

Today is our topic of discussion Graphs of Function .
Graphs of Function
Function is detected by representing geometrically in a plane. This geometrical representation is the drawing of graphs. Here we discussed the method of drawing graphs of exponential, logarithmic and absolute value function.
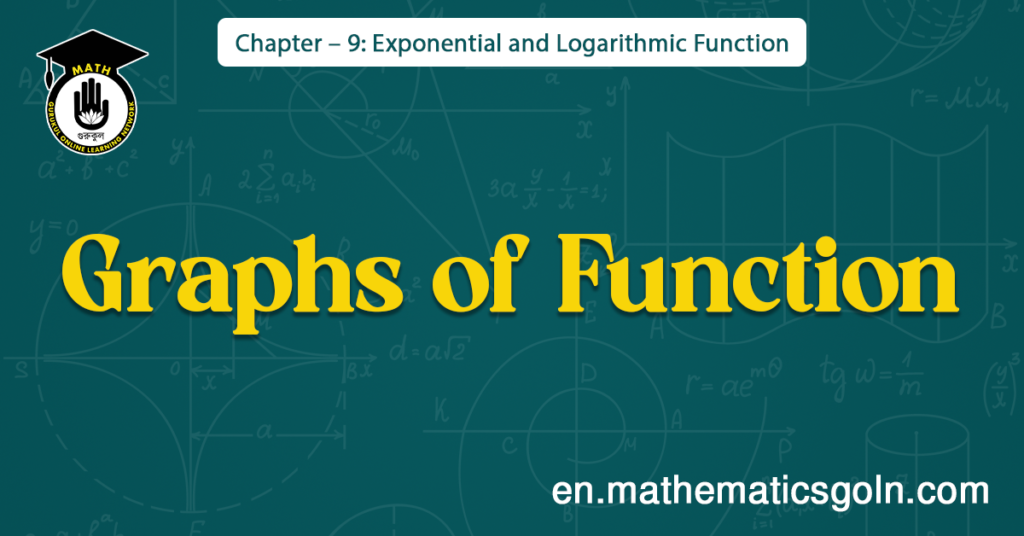
(1) Draw the graph of y = f(x) = a^x
(i) when a > 1 and x is any real number then; f(x) = a ^ x is always positive.
Step 1. For positive value of x, the value of f(x)=a^x is increased with the increase of x.
Step 2. When x = 0 , y = a^0 = 1 , therefore, (0, 1) is a point on the line.
Step 3. For negative value of x, the value of f(x) is decreased with the increase of I. i.e if x -> – ∞ then y -> 0 .
Here, the graph of function y = a ^ x , a > 1 is shown beside. Here D_{f} = (- ∞, ∞) and R_{f} = (0, ∞)
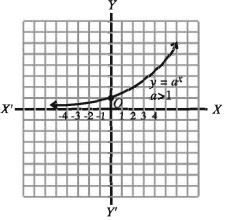

(ii) When 0 < a < 1 x is real, then y = f(x) = a^x is always positive.

Step 1. Observe if the value of x is increasing from the right side of origin, i.e if x \rightarrow ∞ then y -> 0
Step 2. When x = 0 then y = a ^ 0 = 1 hence (0, 1) lies on the line.
Step 3. When a < 1 , the value of x is negative and monotone increasing to the left side from the origin then y is X’ — monotone increasing. i.e y -> ∞ .
Let, a= 1/2 <1=-2,-3….,
y = f(x) = a^x = (1/2) ^ – 2 = 2², y = 2³ , y =2 ^ n When then graph of y -> ∞
y = f(x) = a ^ x is shown beside.
Here D_{f} = (- ∞, ∞) and R_{f} = (0, ∞)
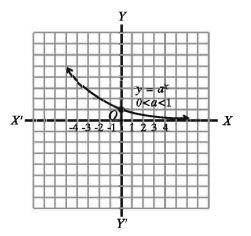
(2) Sketch the graph of f(x) = log:
(i) Let, y = f(x) = log, when 0 < a < 1. the function can be written as
x = a¹
Step 1. When y’s positive value is increasing and increasing, i.e, y→ ∞ then x tends to zero, i.ex → 0. Y
Step 2. As aº 1 hence y = log,1 = 0, So = the line goes through (1,0). y
Step 3. The negative value of y, i.e. decreases below origin point, i.e y → -∞ then, x increases continuously, i.e x → ∞.

In the figure beside, y log, 0 < a < = 1 is shown. Here D = (0, 0) and Rf =
(-∞, ∞0). у
(ii) when y = log, a> 1 then
Step 1. When a > 1, for all y, x is positive and with increasing values of y, x increases. i.e if y→ ∞o then → ∞.
Step 2. As aº 1 hence y = log1 0 So, = the line passes through (1,0) =
X’
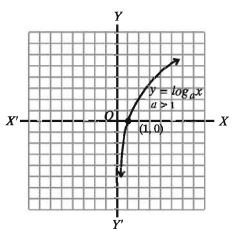

Step 3. If for negative values of y, y keeps increasing i.e., if yoo then z tends to zero. i.e → 0.
Now, graph of f(x) = log,x, a> 1 is shown here Here D = (0, ∞) and Rf = (-∞, ∞0)
See more: